Medical Imaging Wait Times
Information posted on December 12, 2024
Timely access to medical imaging services is a priority for the Saskatchewan government. The Ministry of Health works closely with the Saskatchewan Health Authority (SHA) and the Saskatchewan Cancer Agency (SCA) to reduce wait times for imaging services and improve the patient experience. In particular, efforts are underway to reduce wait times for high-demand services like Magnetic Resonance Imaging (MRI), and Computed Tomography (CT) scans.
Medical imaging services provide a vital component for accurately diagnosing medical conditions. They are used in conjunction with the best clinical judgment of the physician and in consultation with the patients to diagnose medical conditions and injuries. Some imaging modalities are also used in interventional radiology, a minimally invasive surgical procedure, in the treatment of patients, such as catheter-delivered stents, where the surgeon uses medical imaging during the procedure to monitor appropriate placement of the stent.
Wait time performance data for the most recent available quarter of the current fiscal year for MRI and CT services is posted online.
1. Interactive Wait Times Graph
To see results for MRI or CT wait times, select options for Service Type, Region of Service and Priority level.
Average, median and 90th percentile
The average wait time is calculated by adding up the wait times for all the procedures performed and then dividing the sum by the number of procedures performed. The average can be affected by outliers, such as longer wait times for certain CT/MRI scans that require a general anesthetic.
Half of the patients received the procedure within the median wait time or less. For example, if the median wait time is 30 days, half of patients waited 30 days or less and the other half waited more than 30 days. The median is an alternative way of measuring a central tendency for wait times. It is not influenced by outliers as much as the average.
The 90th percentile wait time is the time by which nine out of 10 (90%) of patients received the procedure. Looking at the median (50th) percentile and the 90th percentile gives you a good idea of the wait time experience for the vast majority of patients, and excludes exceptions that might give an exaggerated sense of how long most people are waiting. This means that exceptions such as patients that wait longer for a specialized service such as a scan under general anesthetic may be excluded. If the 90th percentile is relatively close to the median, it's a sign that most procedures are being performed in an efficient manner.
2. Interprovincial Comparisons
The Canadian Institute for Health Information (CIHI) works with the provinces and territories to produce an annual report on wait times for priority procedures in Canada. Provinces work together with CIHI to agree upon common definitions for wait times. Wait times for CT and MRI scans are calculated by each jurisdiction and the summarized data is sent to CIHI for inclusion in the report.
The Saskatchewan CT and MRI information reported to CIHI is calculated by the Ministry of Health. The methodology is exactly the same as the information reported on this page each month. Contrary to the CIHI definition, Saskatchewan does not exclude patients under 18 years of age in the information submitted to CIHI and posted here.
Discrepancies between the results posted here and in CIHI's report might be due to the time periods chosen for reporting the wait times for completed procedures and/or a different cut of the live database, which is subject to minor changes as data is added or corrected.
Historical data for procedures performed prior to 2015 did not come directly from the Radiology Information System because Regina did not start reporting to the system until May 2014. Only Regina and Saskatoon were included in the older data submitted to CIHI. This different data source may result in a break in trends detected under the previous reporting method. Data for April 2015 onward is more stable and includes all health regions and a common database and extraction method.
CIHI is an independent, not-for-profit organization that provides essential information on Canada's health system and the health of Canadians. See the CIHI website for more details.
3. Progress Toward Wait Time Targets
Saskatchewan uses urgency classifications to prioritize scheduling of patients in accordance with their clinical requirements to ensure that patients’ medical imaging needs are served in a timely manner. The more medically urgent your exam, the sooner you will receive it. Likewise, if your exam is considered non-urgent, you may wait longer, depending on the number of other exams that are of a more urgent nature.
There are four urgency levels, each with a wait time target for when the exam is targeted to be conducted.
Urgency Level | Target Wait Time | Example |
1 - Emergency | Within 24 hours | Traumatic spinal cord injuries and brain hemorrhage |
2 - Urgent | within - 7 days | Suspected brain lesions and chest tumours |
3 - Semi-urgent | within - 30 days | Spine lesions and congenital heart disease |
4 - Non-urgent | within - 60 days | Chronic joint pain and investigation of dementia |
The targeted wait times listed above are guidelines only and do not reflect the current wait time for services |
These guidelines are based on the impact of imaging studies on intervention, and on patient management. Conditions for which imaging has a lesser impact on effective early intervention are ranked as a lower priority, while conditions which benefit from early diagnosis with imaging are ranked correspondingly higher. Pre-operative and acutely ill patients are given a higher priority when imaging is useful for diagnosis or operative planning.
The following table is a summary of MRI or CT volumes, wait times, and cases waiting during the latest reported three-month time period.
4. Radiology Information System
CT and MRI information is reported to the provincial Radiology Information System (RIS). CT and MRI information provided by private facilities on contract to the Saskatchewan Health Authority is also included. Each facility began reporting on a different date, so analyzing long-term trends can be difficult.
The wait time is calculated from the date the procedure is requested to the date the procedure is performed. Emergency procedures and scheduled follow-up procedures for routine screenings are excluded from the wait time calculations, but are included in the volumes of procedures performed. Wait times for emergency procedures are not reported, since the request time for these procedures is not usually recorded in the RIS.
Services Reported
Currently only CT and MRI wait times are reported. Although the RIS collects wait times for other types of imaging services such as ultrasound and x-rays, these are not reported because data is incomplete (due to missing information from privately-run service providers). Wait times for PET CT and nuclear medicine will be reported in the future. Additional time is required to establish the methodology, as one procedure may involve multiple visits.
Although facilities are now all on the same reporting system, there are still some improvements to the way information is recorded that could improve the accuracy of the data. For example, the ministry plans to work with the Saskatchewan Health Authority and eHealth Saskatchewan to standardize the manner in which follow-up cases are flagged.
5. Supply and Demand
Between 2007-08 and 2023-24, the Saskatchewan health system has increased its capacity for MRI services by approximately 154% (from 15,700 to 39,842 patients) and increased capacity for CT services by approximately 103% (from 75,000 to 152,172 patients). Funding for the medical imaging program has increased by approximately 113% between 2007-08 and 2023-24.
In 2023-24, 39,842 patients received an MRI scan, and 152,173 patients received a CT scan, representing a 7.3 % increase in MRI and a 6.6% increase in CT over the previous year.
In the 2024-25 budget, additional funding of $5.062 million has been provided to increase MRI capacity by 3,160 patients and 8,530 CT patients.
This interactive Tableau chart shows monthly requests (demand) for medical imaging services, patient visits (supply) and cases waiting (backlog).
Filter the results by selecting:
- Priority level,
- Service type, and
- Region of Service.
6. Wait Times Snapshot
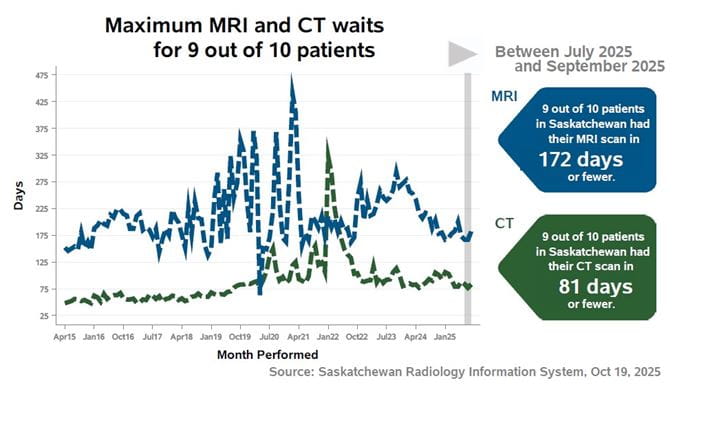
The Ministry of Health is working with its health system partners to enhance the reporting of diagnostic imaging wait time information. The following chart shows the maximum length of wait experienced by nine out of 10 Saskatchewan patients who received their MRI or CT scans during the most recently reported three-month period. Statistics are updated quarterly.
The 90th percentile wait time was 206 days for MRIs performed in the second quarter of 2024-25 (July to September, 2024). As indicated in the graph, there was a decrease of 16 days in Q2, 2024-25 over Q1 2024-25.
The overall MRI waitlist decreased by 137 patients from the previous quarter.
The 90th percentile wait time was 88 days for CTs performed in the second quarter of 2024-25 (July to September 2024). As indicated in the graph, this represents an increase of 8 days from Q1 2024-25.
The overall CT waitlist decreased by 51 patients from 8,076 on June 30, 2024 to 8,025 at the end of September.
The graphic below has been updated to reflect Q2 2024-25 results.